|
<< Click to Display Table of Contents >> Simulation Output |
  
|
|
<< Click to Display Table of Contents >> Simulation Output |
|
Available in v12 and higher
Available in Dynamic Analyst
Updated in v18.0
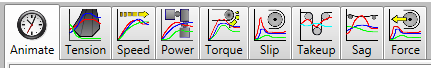
The output is displayed in a series of charts. Data is from the case currently being evaluated, that is the selected operating case and the selected dynamic case. These chart icons are displayed on the screen for the Home Menu Item.