|
<< Click to Display Table of Contents >> Animation Chart |
  
|
|
<< Click to Display Table of Contents >> Animation Chart |
  
|
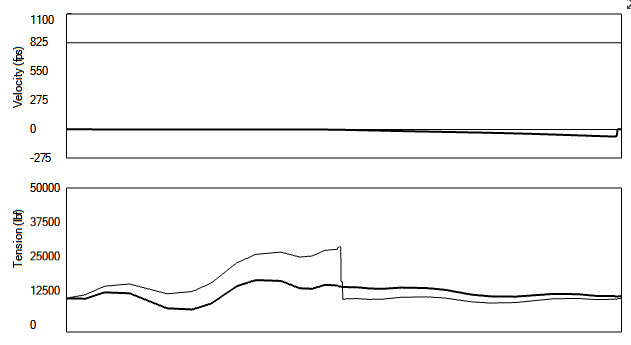
The simulation produces an animation of the belt speed and tension along the conveyor belt over the simulation period. This can be viewed by going to the animation display.

The animation is displayed on the two level graph. The upper chart shows the belt speed from the tail end (left edge) along the carry side to the head end (center) and back along the return side to the tail end (right edge). The lower chart shows the belt tension at the same locations.
