|
<< Click to Display Table of Contents >> Plot Points |
  
|
|
<< Click to Display Table of Contents >> Plot Points |
|
The user can customize the output on the X-Y charts by inputting labels and picking the points to be plotted. These points are grouped into sets so the user can construct a custom plot point selection. A default set of points in the first set includes the head, tail, takeup and drives.
The procedure for managing this is controlled by Plot Point Buttons located in the upper right corner of the output chart window.
![]()
•Click on the drop down list to select the set of points to be currently displayed.
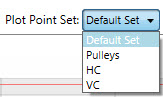
•Click on the "Edit" button to access the window for defining and editing the plot point sets.
Editing the plot points is managed in the Plot Point Window.
•The flight segments are shown on the screen with their position on the conveyor, current labels and current plotting selections.
•The plot points selected for any BA case or DA case associated with the current conveyor file will be the same. Changing the plot points for any case will therefore change the plot points for all cases.
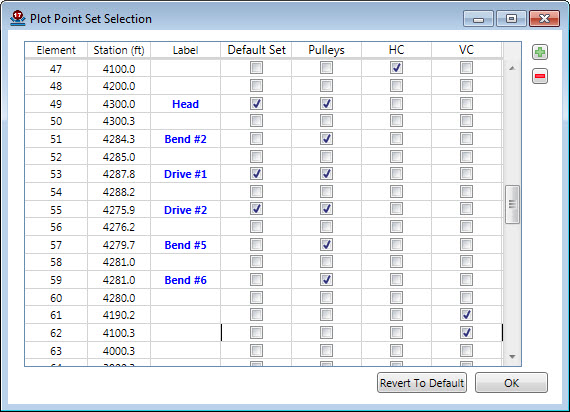
Plot point sets can be created or removed using the "+" and "_" buttons in the upper right corner of the window.

•When adding a set, the user is prompted for a set name.
•When deleting a set, the user must first click on the set to identify which is to be removed.
By clicking on the desired flight segment, the plot points and labels can be selected.
•Label Segments.
The takeup location must be labeled "Takeup".
The first two characters of drive locations must be "Dr" to be plotted on the Power, Torque and Slip graphs. The first two characters of a brake location must also be "Dr" to be displayed on the Torque and Slip graphs.
•Select points to plot by checking the box. Each conveyor flight can be included in any combination of plot sets.
To display the power, torque and slip of the drive and brake pulleys, they must be included in set 1 of the plot points.
Multiple sets of plot points can be used when the number of points of interest is high or displaying the points on separate charts provides a clearer presentation. The print routines will allow the option of printing all the points on multiple charts.
Once the desired changes have been made, the procedure can be terminated and saved by clicking on the "OK" button.
The "Revert To Default" button will undo all the user input and return to the default selection.