|
<< Click to Display Table of Contents >> Case Summary Output |
  
|
|
<< Click to Display Table of Contents >> Case Summary Output |
|
Available in v18.1
Available in Dynamic Analyst
Updated in v18.1
This graphic tool is used to visualize the Dynamics results across multiple load cases and across the entire Starting and Stopping process. The data from selected cases is plotted to compare the results from multiple simulations. Data is available from all cases being evaluated, that is operating cases and dynamic cases.
All the simulations must be current and up to date.
The output is displayed in a series of charts. These chart icons are displayed on the screen for the Case Summary menu item.
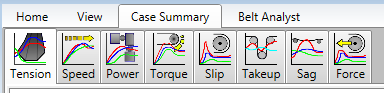
•Slip
•Sag