|
<< Click to Display Table of Contents >> DA Case Summary Slip |
  
|
|
<< Click to Display Table of Contents >> DA Case Summary Slip |
|
The Slip summary chart is an X-Y chart of the slip ratio at the drive pulley at one selected point on the conveyor, for selected operating case(s) during the simulated period of starting, running and stopping.
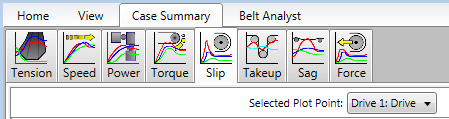
•Selecting the Case Summary menu item.
•Clicking the Slip tab icon.
•The available plot point(s) are drives locations: these are defined in BA. They are the same points that can be displayed in the individual case simulation output display and charts.
•Select the point from the "Selected Plot Point:" drop-down list.
A table of the minimum and maximum values for each case is displayed below the chart with the descriptions color coded to the lines. Clicking on the box next to a specific case description determines whether the line is displayed on the graph.
•If it is colored, the line is shown; if it is empty (white) then it is not shown.
•If are many cases and want to display just one of them, right-click on the color box of the desired case to show only that line. Attempting to hide the only showing line results in all lines being shown again.
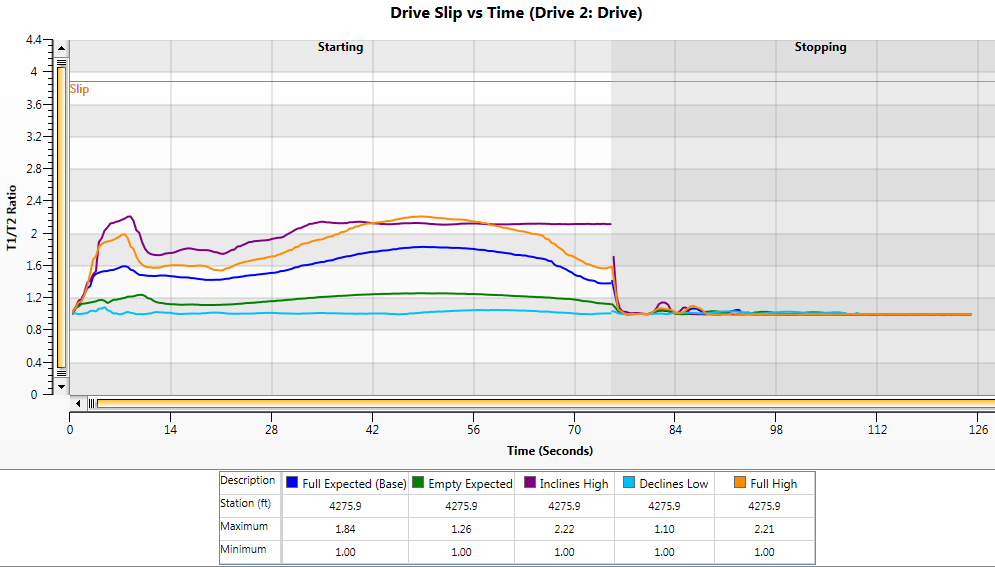
The plot begins with the starting sequence and then goes to the stopping sequence. The chart shading indicates the transition point. This range can be reduced by dragging the scroll bar between the chart and time axis labels.
If the stating simulation time is long enough, the plot at the end of the starting data should be constant and represent the running condition.
The thin gray horizontal line indicates the maximum recommended slip point at the pulley (from BA).
By right clicking on the chart, the user can either create a "csv" text file of the chart data,a "png" picture file of the image or copy to clipboard.
See Also: Plot Points, Case Summary Output