|
<< Click to Display Table of Contents >> Tension Graph |
  
|
|
<< Click to Display Table of Contents >> Tension Graph |
  
|
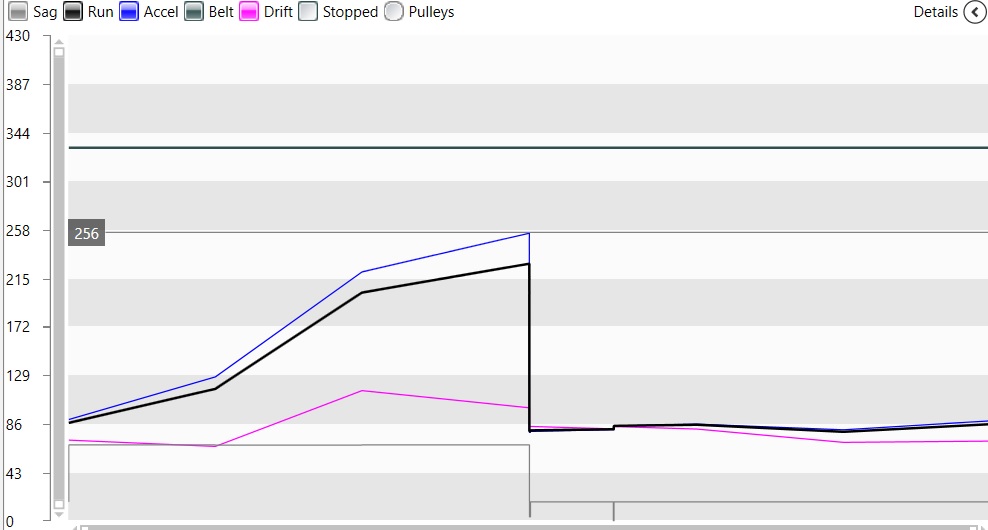
A graph of the belt tension is included in the main screen.
•The tension graph starts off on the left side at the tail of the conveyor and progresses through the length of the carry side, around the head pulley, back along the return side and ends on the right side at the conveyor tail.
•Four separate tension plots are given - Running, Acceleration, Decel (either drift or decel), stopped and the minimum tension allowed for Sag.
The Acceleration and Deceleration lines can be removed from this display by checking the appropriate box in the boxes on the main screen.
•The intermediate horizontal line depicts the rated tension of the belt. The horizontal line, or top, of the graph depicts the belt tension limit for acceleration or transient spikes.
The tension limit for transient spikes is normally recognized to be 150% of rated belt tension but can be adjusted on the customized defaults screen.

Additional data can be displayed:
•Positioning the cursor over the graph displays the belt tension in the lower right corner of the graph..
•Right clicking on the "details" button, in the upper right corner, displays the minimum tension, average tension and maximum tension for running, accelerating and decelerating.