|
<< Click to Display Table of Contents >> Results |
  
|
|
<< Click to Display Table of Contents >> Results |
|
The analysis results are displayed on two charts. These can be selected by clicking on the appropriate menu item.![]() or
or ![]()
The relationship between friction and slip is presented in the graph.
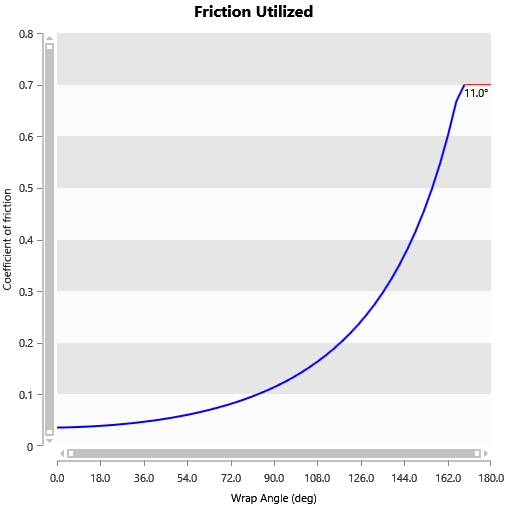
•X axis is angle of wrap starting at point belt enters pulley do where it exits the pulley.
•Y axis is coefficient of friction.
•Curved blue line indicates coefficient of friction necessary to prevent slipping.
•Horizontal dashed blue line shows the friction limit for the selected lagging.
•Red line shows the potential for a local slip zone.
It is not uncommon to have some local slip. The is a possible source of some lagging and belt wear.
The shear stress chart shows the estimated shear in the lagging rubber.
The average shear stress can be interpreted as the shear stress in the body of the lagging needed to transfer the torque of the drive pulley with the additional effects of the belt shrinking (due to tension change over the drive) while in contact with the drive pulley.
The stress corrected for contact can be interpreted as the shear stress at the top surface of the lagging (contact between the belt and the lagging) corrected for the reduction in contact area due to the existence of grooving within the lagging design.
The stress within the slip zone is the average shear stress located within the area of predicted localized slip.
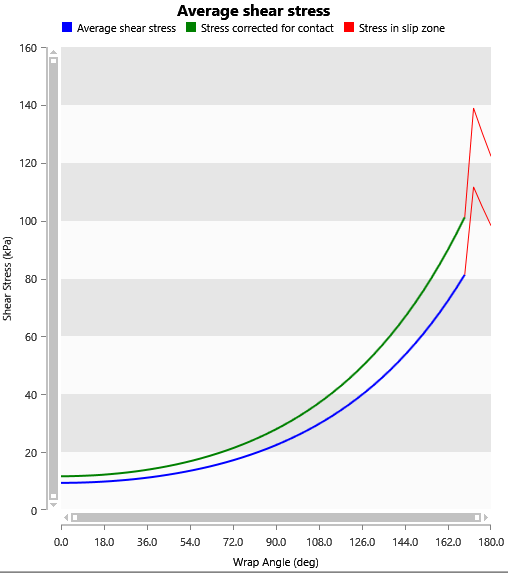
High shear may damage the lagging but this is typically not a concern except for pulleys with high tension.