|
<< Click to Display Table of Contents >> Belt Tension Plot |
  
|
|
<< Click to Display Table of Contents >> Belt Tension Plot |
|
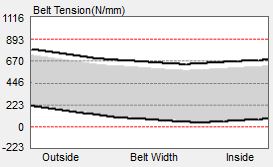
The graphic shows the tension profile across the width of the belt. The outside edge of the belt is on the left axis and the inside edge of the belt is on the right axis. The two lines represent the high operating tension and low operating tensions as defined in the tension input.
The gray band represent the running tension range while the white regions represent the acceleration/deceleration range.
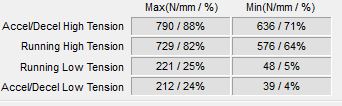
The tension table shows that maximum and minimum tension values.