|
<< Click to Display Table of Contents >> Horizontal Curve Details, Standard Belt |
  
|
|
<< Click to Display Table of Contents >> Horizontal Curve Details, Standard Belt |
|
Available in v16.1 and higher
Available in Suite
Updated in v16.1
Click here to watch a video on how to add a horizontal curve to Belt Analyst
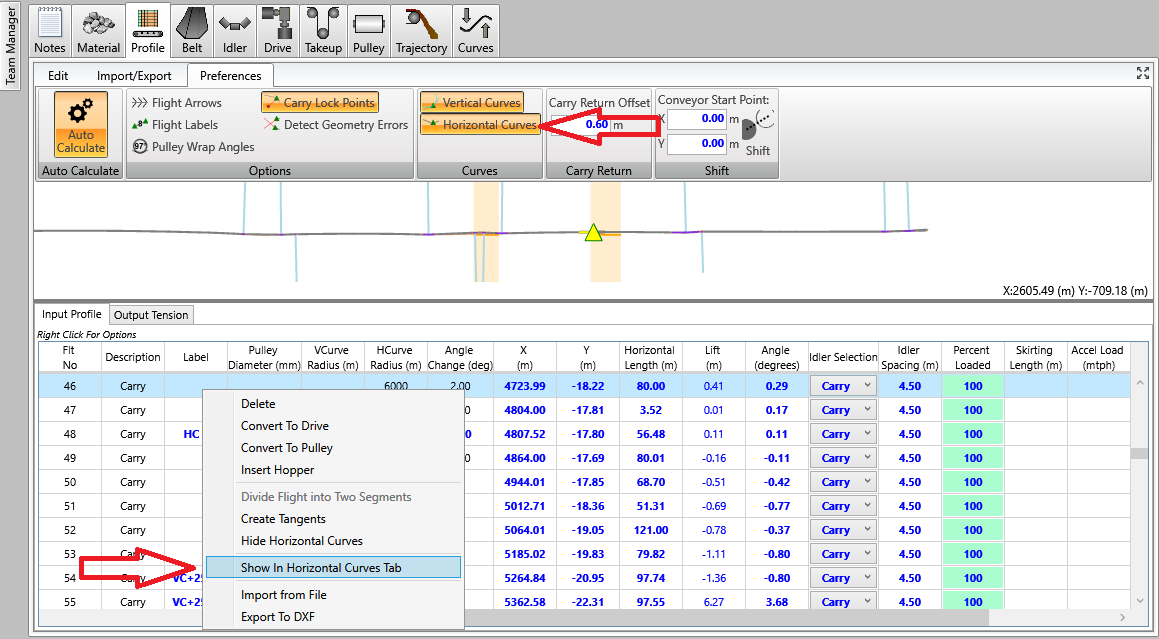
To add horizontal curves to a conveyor calculation you can either right mouse click on the flight grid on the profile tab and click the Show Horizontal Curves menu item or you can go to the toolbar within the flights tab and toggle the Horizontal Curves button under the preferences tab (see arrows on image above). Note that this feature is only available to users licensed with Belt Analyst Suite and the conveyor profile must be in advanced profile mode.
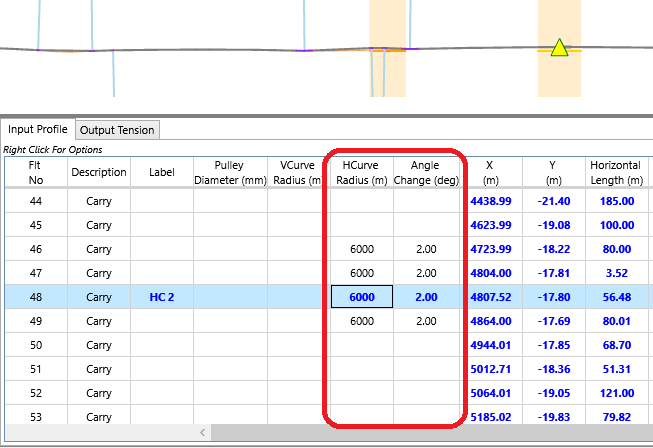
Showing the horizontal curves will add two columns to the flight input grid allowing a user to input the horizontal radius and angle change created by the horizontal curve. Note that the user input radius and angle change for a horizontal curve should be input on a flight point that exists at the exact midpoint of the horizontal curve. Based upon the input radius and angle change, belt analyst will then automatically apply the horizontal curve radii and calculation to every flight point that exists within that horizontal curve. The 2D scale profile drawing will then show a shaded area representing the location of the input horizontal curve (see image below). Horizontal curve calculations including belt drift and input banking angles will be added to the curves tab for each horizontal curve added to the conveyor profile.
Click here to watch a video describing the Horizontal Curve Calculations on this tab
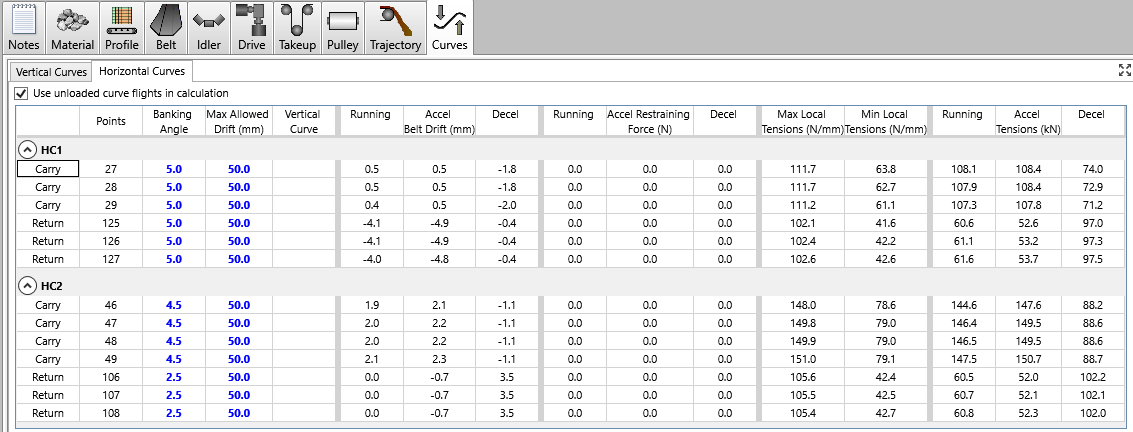
Each input horizontal curve on the flights tab will have a group of calculations for every flight that exists through that curve (carry and return).
Each Column Displayed in the Horizontal Curve Calculation grid is described below. Everything in blue is editable. Everything that is red indicates an out-of-spec condition. Everything in black is a calculated output.
•Points show the flight points that exist within each horizontal curve (carry and return are labeled too). These points match up to the flight points on the profile tab. Note that the radius of each horizontal curve can only be edited from the Flights grid in the Profile tab as described above
•The Banking Angle represents the angle super-elevation tilt towards the outside of the horizontal curve. Banking angle can be different for every flight point.
•The Max Allowed Drift represents the maximum allowable side to side movement of the belt within each curve point before the belt contacts a restraining roller.
•The Vertical Curve column displays information as to whether the flight point exists within a vertical curve making the curve calculations represent a compound curve. A blank within the vertical curve column means that there is no vertical curve at that point.
•The Belt Drift columns display the resulting side to side belt movement for the three tension cases within Belt Analyst (running, acceleration, deceleration) based upon the input banking angle and case belt tensions.
•The Restraining Force columns display the resulting restraining force on the edge of the belt if the resulting belt drift wants to exceed the input max allowed drift. The amount of allowable restraining force can be edited within the belt analyst defaults screen on the geometry tab.
•The Min/Max Local Tensions columns display the resulting minimum and maximum local stresses across the width of the belt due to bending the belt through the horizontal curve. These tensions can also reflect the combination of horizontal and vertical curves if the flight point exists within a vertical curve. These values are checked against the local tension limits defined by the user on the belting tab.
•The Tensions columns display the average belt tension across the width of the belt at each flight point for the three tension cases (running, acceleration, deceleration).
Please note that the effective friction coefficient describing the resistance to belt drift as well as the maximum allowable restraining force are defaults in the program and can be edited by going to the defaults screen and clicking on the geometry tab.
There is a check box for “Use Unloaded Curve Flights in Calculation” at the top right of the horizontal curve tab. By default this option is clicked. This is done because it is more conservative to calculate the belt movement (drift) ignoring the load from the material as the belt will move more this way. The user can decide to perform the belt drift calculations based upon the user input load on the flights tab by unchecking this option.