|
<< Click to Display Table of Contents >> LRR Rubber Belting |
  
|
|
<< Click to Display Table of Contents >> LRR Rubber Belting |
|
Mark A. Alspaugh, P.E. President Overland Conveyor Co Inc
Allen V. Reicks, P.E. Vice President Overland Conveyor Co Inc
Recently, some automobile tire manufacturers have been advertising how much money you can save when using their tires. Is this real or just another marketing scheme to get you to buy their brand? In this case, low rolling resistance tires are real. These tires are designed to improve fuel efficiency of a car by minimizing the energy wasted as heat as the tire rolls down the road. A 2003 California Energy Commission study concluded that approximately 5–15% of the fuel consumed by a typical car may be used to overcome rolling resistance.
What is rolling resistance exactly? Very simply, it is a measurement of how easily the tire rolls down the road. Consumer groups have found that rolling resistance differences of 20 to 30% are not uncommon among tires of an otherwise similar size and type. The conclusion is an individual vehicle could save up to 6% of its gasoline use if it were fitted with very “efficient” tires, paying for the additional cost in about one year. In other words, a typical compact car such as a Ford Focus can improve its mileage from 30 mpg to 32 mpg simply by using lower rolling resistance tires.
To use a simpler example than a tire, consider a round object such as a pipe rolling on a flat surface (Figure 1). Rolling resistance is caused mainly by the deformation of the pipe and/or surface. (Additional contributing factors include pipe radius, rolling speed, surface adhesion, and relative micro-sliding between the surfaces of contact.) Since deformation is important, resistance depends very much on what the pipe and surface is made of. For example, a rubber surface will give a bigger rolling resistance than a steel surface. Also, sand on the ground will give more rolling resistance than concrete. The greater the resistance, the larger force (F) required to roll the pipe.
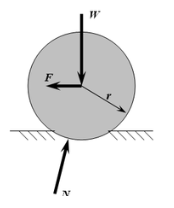
Figure 1
In a belt conveyor, flip Figure 1 upside down and we have a rubber belt indenting into the steel idler rolls that support it and the load it carries (Figure 2).
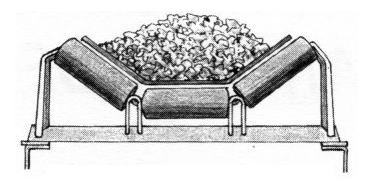
Figure 2
As the belt rides over the rolls, it is easy to visualize how the roll indentation into the rubber causes resistance to motion (Figure 3). The belt rubber is squeezed between the idler roll and the tensioning elements of the belt carcass as it transfers the material and belt weight to the idler roll. As the belt contacts the leading edge of the idler roll, movement is hindered as the rubber deforms under this squeezing pressure. Conversely, belt movement is aided on the back side of the roll from the restoring reaction as the indentation deformation decreases. Since the rubber, as a viscoelastic material, does not react instantaneously, a portion of the work of deformation is not returned. The resulting deformation energy loss is absorbed by the belt as heat and seen as a net resistance to movement in the direction of belt movement through the moment that develops due to the offset between the center of the roll and the center of the vertical reaction.
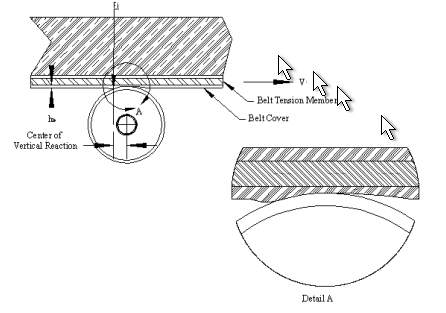
Figure 3
Rubber indentation energy loss varies primarily with the belt covers’ rubber thickness and stiffness, the idler roll radius and the perpendicular loading. Just as important is the degree to which the rubber reacts elastically to return the energy of deformation to the system. This is affected by the rubber composition, the rubber temperature and to a lesser degree, the belt speed. Though the rubber itself can be a design variable, a composite performance characteristic is provided which is suitable for design with commercially available cover compounds. The general calculation of resistance to movement due to belt rubber indentation per CEMA 6th Edition follows in Figure 4 where:
Where:
ΔTbin (lbf) =Tension increase from viscoelastic deformation of the belt cover
TF (° ºF) = Operating Ambient Temperature
KbiR = Viscoelasticity characteristic of belt cover rubber
Pjn = Cover indentation parameter. (Dimensionless)
E0 (psi) = Rubber stiffness property
Dr (in) = Roll diameter
hb (in) = Belt cover thickness
wi = Load distribution factor
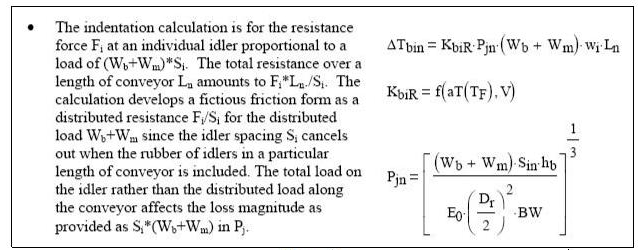
Figure 4
Of course this process of quantifying rubber indentation resistance is complex and this is just a small sample of the process. The actual derivation and validation of these methods are beyond the scope of this paper.
But why would different types of rubber cause more or less resistance?
To answer this, we must understand viscoelasticity; a property of materials that exhibit both viscous and elastic characteristics when undergoing deformation. Viscous materials, like honey, resist shear flow and strain linearly with time when a stress is applied. Elastic materials strain instantaneously when stretched and just as quickly return to their original state once the stress is
removed. The viscosity of a viscoelastic material gives the substance a strain rate dependent on time. Purely elastic materials do not dissipate energy (heat) when a load is applied, then removed (Figure 4-a). However, a viscoelastic substance loses energy when a load is applied, then removed. Hysteresis is observed in the stress-strain curve (Figure 4-b), with the area of the loop being equal to the energy lost during the loading cycle. Since viscosity is the resistance to thermally activated plastic deformation, a viscous material will lose energy through a loading cycle.
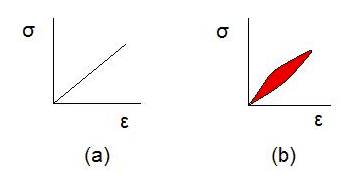
Figure 4
In other words, when rubber belts roll over an idler roll, energy is required to indent or deform the rubber and energy is recovered as the rubber rebounds back as it exits the roll. The difference between whats required and whats recovered is the net energy loss or resistance to motion due to rubber indentation.
Because this resistance is the difference between indentation and rebound, it is not just a matter of hardness or of any one factor. And what makes one type of rubber better or worse is actually very, very complex. The experimental characterization of rubber’s behavior is known as rheology. Theoretical aspects of rheology are the relation of the flow/deformation behavior of material and its internal structure (e.g., the orientation and elongation of polymer molecules), and the flow/deformation behavior of materials that cannot be described by classical fluid mechanics or elasticity.
Dynamic Mechanical Analysis (DMA) is a technique used to study and characterize materials (Figure 5). It is most useful for observing the viscoelastic nature of rubbers. An oscillating force is applied to a sample of material and the resulting displacement of the sample is measured. The sample deforms under the load. From this the stiffness of the sample can be determined, and the sample elasticity or Figure 5 modulus can be calculated. By measuring the time lag in the displacement compared to the applied force it is possible to determine the damping properties (hysteresis) of the material. The time lag is reported as a phase lag, which is an angle. This damping is often called tan delta, as it is reported as the tangent of the phase lag.
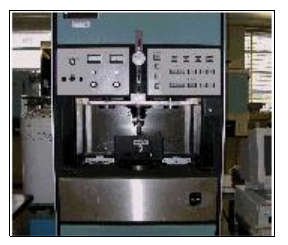
Figure 5
The stiffness, elasticity and viscosity (tan delta) of rubber also vary with temperature and frequency (how fast the rubber indentation occurs i.e. how fast the belt is running). Therefore the DMA testing also must be done through a range of temperatures and frequencies. Typical lab data may look like Figure 6 (each line represents test temperature from -70F to +60F through a range of frequencies).
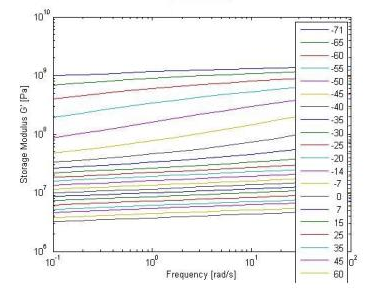
Figure 6
Through a series of complex mathematical manipulations, G’ or storage modulus and G” or loss modulus can be plotted (Figure 7). This is commonly referred to as a master curve for this particular rubber. In simple terms, the difference between the 2 lines represent the energy loss while the test sample is deformed by the tester.
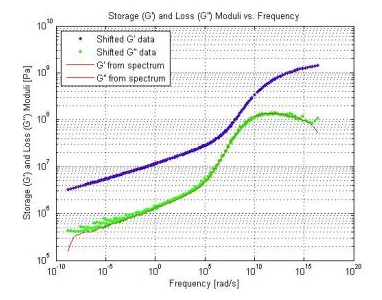
Figure 7
Actual results vary extensively between different compounds. Although an analysis of specific rubbers is outside the scope of this paper, it is generally understood that the base elastimer and type of filler are the main variables. Just as has been documented in automobile tires, it has been widely claimed that rolling resistance can vary by 20-30% between different belt cover compounds.
Per the Conveyor Equipment Manufacturer Association (CEMA) publication, “Belt Conveyors for Bulk Materials”, 6th Edition, power requirements in a belt conveyor are made up of:
1- Lifting or lowering the material
2- Main Resistances
a. Rubber Rolling Resistance
b. Idler Rolling Resistance
c. Idler Alignment
d. Belt and Material Flexure between Idlers (Sag)
3- Miscellaneous
a. Pulleys
b. Cleaners
c. Skirting, etc
If we look at specific applications such as a high incline slope belt coming out of a coal mine (Figure 8), we can display actual power requirements in a pie chart. In this case, lift makes up 90% of total power and rubber indentation only 4%. If we reduce rubber by the high end of 30%, it still only means 1.2% of total power. That’s not very significant. Since there is no way to reduce gravity forces, there are no means through rubber to significantly reduce power on high incline belts.
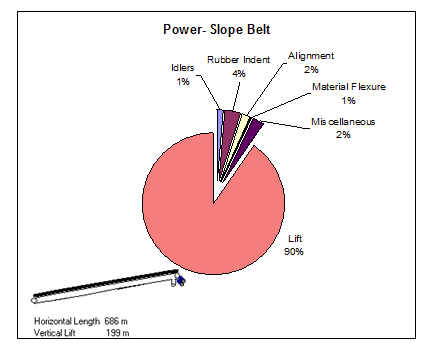
Figure 8
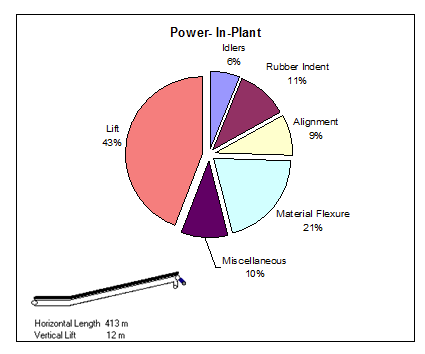
Figure 9
In a typical in-plant conveyor of 400m length, power might be broken into its components as per Figure 9 with lift making up the largest single component at 43% but all friction forces making up the majority. In this case rubber contributes 11%. If we reduce it by 30%, we can reduce total power by 3.3%. This might start to be attractive but it is still probably not cost to pay extra for premium rubber.
But in a long flat conveyor, power components will look much more like Figure 10, with frictional components making up almost all the power. Since rubber makes of 48% of the total, a 30% reduction now means almost 15% reduction in total power. Since this application is very long, the total installed power is 3750 HP so 15% equals 560 HP so the cost savings in power utilized alone could be hundreds of thousands of dollars per year. This is an extreme example but it illustrates that in flat conveyor applications, attention to the rubber is essential.
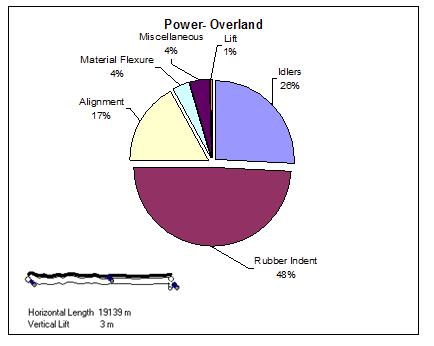
Figure 10
Many publications from reputable academics and researchers have documented that in fact under some circumstances, rubber indentation can be up to 60% of frictional resistance in a belt conveyor. In flat, conveyor it is by far the largest drag resistance and therefore the most important item to consider when attempting to design an energy efficient conveyor.