|
<< Click to Display Table of Contents >> Status Bars |
  
|
|
<< Click to Display Table of Contents >> Status Bars |
|
The status bar contains summary data on the current conveyor and case. The bars are located in the same window as the profile sketch and tension graph. It consists of the following sections:
1.The Running Belt shows the value of the actual maximum running belt tension and a bar showing its percent of the selected belt rating. A value greater than 100% causes the section to flag the user by turning red.
![]()
2.The Total Power shows the value of the actual running power and a bar showing its percent of the total installed power.A value greater than 100% causes the section to flag the user by turning red.
![]()
When the conveyor is regenerative, the power is displayed as negative.
3.The Takeup Mass shows the value of the takeup mass and required takeup tension divided by actual takeup tension.A value greater than 100% causes the section to flag the user by turning red.
![]()
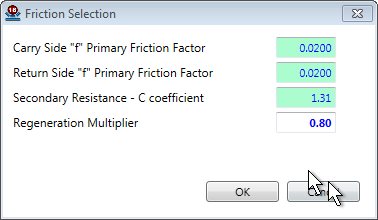
4. The Friction Coefficient f shows the overall conveyor friction factor (DIN/ISO).
![]()
When the drag calculation method selected is DIN or ISO, clicking on this box accesses the Friction Coefficient f screen.