|
<< Click to Display Table of Contents >> How to Properly Input a Pipe Conveyor into Belt Analyst |
  
|
|
<< Click to Display Table of Contents >> How to Properly Input a Pipe Conveyor into Belt Analyst |
|
This is an example of how to setup a pipe conveyor using Belt Analyst™.
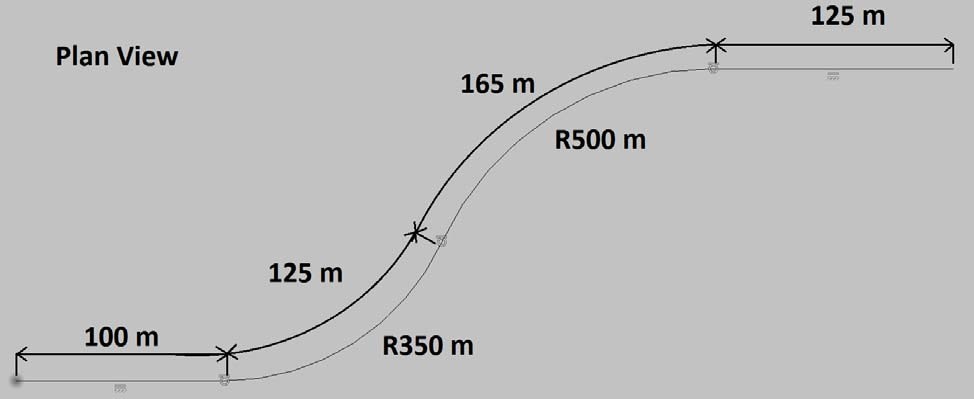
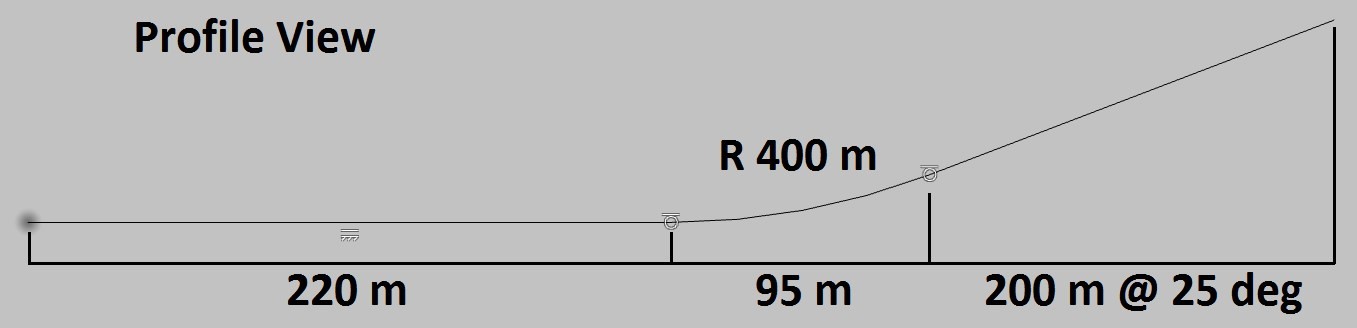
A client of yours wants to design a pipe conveyor that conveys 700 mtph of ROM Coal from point A to point B at 3.4 m/s. The desired plan and profile view for the pipe conveyor geometry are given below. It should be noted that the material flows left-to-right, tail-to-head in the drawings below.
When inputting the pipe conveyor geometry into Belt Analyst, it is important to recognize that curved sections of pipe conveyor will have different drag calculations than straight sections of pipe conveyor. Because of this, curved sections of conveyor must be separated from straight sections of conveyor when creating the flights within Belt Analyst.
A recommended step-by-step process to input the above geometry is described here:
1.Identify the curved sections of the conveyor on the plan and profile views. We can see that there are 2 horizontal curves in the middle of the conveyor, and 1 vertical curve in the middle of the conveyor. The vertical curve overlaps both horizontal curves making for a couple compound curve sections.
2.Open up belt analyst, and create a new file from the default conveyor data, and save the file wherever you need it.
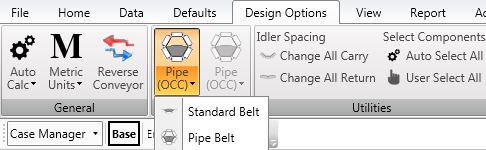
3.Change the conveyor type to “Pipe Belt”; go to the Design Options > Standard Belt and choose Pipe Conveyor
4.Input the conveyor speed (3.4 m/s), tonnage (700 mtph), and material information (ROM Coal).
5.Go to the flights tab to input the geometry. Remember we must distinctly separate each curved section and each straight section:
▪Insert a flight at position 1. This flight will represent the first section of the conveyor. Looking at the plan and profile drawings, the conveyor goes 100 meters in a straight direction before reaching a horizontal curve. We can also see from the profile view, that the first 100 meters is part of a larger 220 meter flat section of conveyor. Subsequently, make flight 1 100 meters in length and 0 meters in lift.
▪Insert a flight at position 2. This flight will represent the section of conveyor following the first 100 meters. The plan view shows that the horizontal curve travels 125 meters at a radius of 350 meters. However, the profile view shows that after the first 100 meters, there is another 120 meters before the conveyor enters a vertical curve. Because we want to separate each differently curved section, make flight 2 120 meters in length and 0 meters of lift. This flight represents the part of the conveyor traveling through the first horizontal curve, but not in the vertical curve portion yet.
▪Insert a flight at position 3. This flight will represent the section of conveyor that is still in the first horizontal curve and is also in the vertical curve portion. Make flight 3 5 meters in length and has a 12.5 degree incline. I’ve made the incline rise at 12.5 degrees because I like to model a vertically curved section as the angle of inclination in between the curve’s starting angle and finishing angle. This is a simplifying assumption that makes it easy to input. Of course you can calculate the average inclination angle for the first 5 meters, however, I find that the simplification I’ve done here barely affects the overall results.
▪Insert a flight at position 4. This flight will represent the conveyor after the first horizontal curve, and through the rest of the vertical curve. The drawing shows a second horizontal curve starting immediately after the first horizontal curve of length 165 meters. The vertical curve is 95 meters in horizontal length total. This means we should model the section of conveyor that is vertically curved AND horizontally curved in horizontal curve 2. Make flight 4 90 meters in length and have a 12.5 degree inclination.
▪Insert a flight at position 5. This flight will represent the conveyor after the vertical curve (at full 25 degree inclination) but still within the second horizontal curve. Make flight 5 75 meters in length and 25 degrees in inclination.
▪Insert a flight at position 6. This flight will represent the conveyor section that is not in any curve at full inclination. Make flight 6 125 meters in length and 25 degrees in inclination
▪Your flight table should look like the following image:
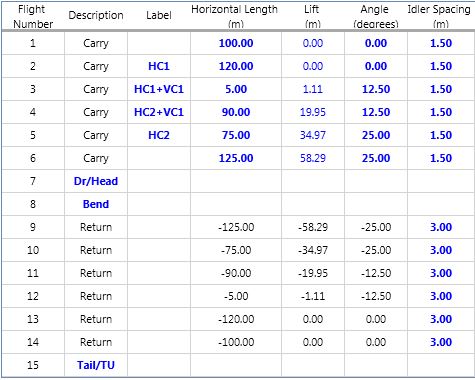
▪Note that I’ve labeled each flight according to how each section is curved to help me keep track of what each flight represents. This will help when I input the curve information.
6.Inputting the Curve Information
▪Go to the curves tab and hit the “Expand Folder” button on the toolbar to make the entire curve table visible. Your curve table should look similar to the one shown here:
![]()
▪Unlike with traditional troughed conveyors, Belt Analyst does not automatically recognize curves when calculating pipe conveyors. Curves must be input manually. Curve radii MUST be input for an accurate calculation because the drag of a pipe conveyor system is very dependent upon the pipe conveyor curves.
▪Entering in a label to either the vertical curve label column or the horizontal curve label column will highlight the row the label is input into with a color. If multiple rows have the same label, the color will also be the same. These colors help visualize the different curve types on the conveyor.
▪Input a “Horizontal Curve Label” for flight 2 of “HC1”. This highlights the row 2 horizontal curve section in a blue color. The plan view shows that horizontal curve 1 starts 100 meters from the tail and has a radius of 350 meters. Notice that the “station” column of row 2 shows that station to be starting at 100 meters. This confirms that flight 2 represents the start of the horizontal curve. Input a horizontal radius of 350 meters for flight 2 as well. This will automatically create a return‐side horizontal curve input for the same horizontal curve at the same location along the conveyor for the return side of the pipe conveyor.
▪Please note that inputting the radius makes sure that the drag calculation for the flight is now accurate.
▪Because flight 3 is also a part of horizontal curve 1, input a horizontal curve label for flight 3 and input the horizontal curve radius of 350 meters. Notice that when you input the same curve label, the colors are the same.
▪Flight 3 also is part of a vertical curve. Input “VC1” in the vertical curve label for flight 3. Also input the vertical curve 1 radius of 400 meters. When inputting the vertical curve radius, notice that you also should input the vertical curve type (concave or convex).
▪Continue to label the curves and input the radii according to the drawing. When you are finished, your curve table should look something like this:
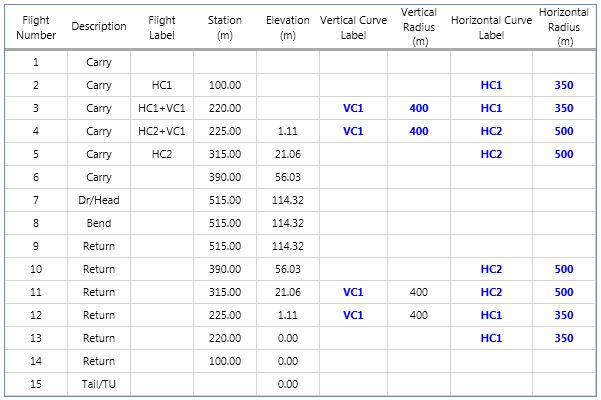
Once you have the curves input, you can go through your component selection as you would with a conventional troughed conveyor.
See Also: Rules of Thumb