|
<< Click to Display Table of Contents >> Belt Capacity |
  
|
|
<< Click to Display Table of Contents >> Belt Capacity |
|
Available in v18.2 and later
Available in Suite
Updated in v18.2
Belt Capacity is accessed from the Analysis tab in the main Belt Analyst window.
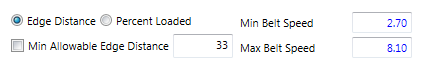
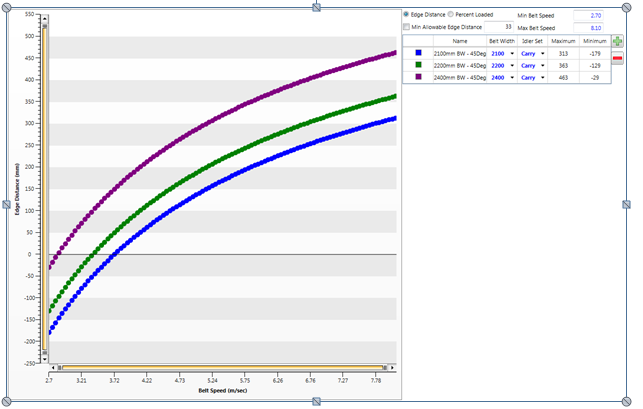
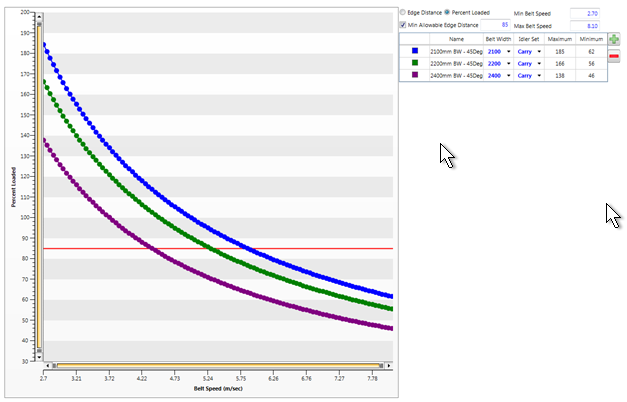
Belt Capacity can plot either Edge Distance or Percent Loaded results over a range of belt speeds for the conveyor load defined in the current case.
Users can test the effects of Belt Width and Idler Sets on the belt capacity. Each line item in the grid is a different test case. Users can modify the belt width by selecting a standard measurement or by entering one specifically. Also any idler set in the main Idler Tab inside Belt Analyst will show up in the drop down list under Idler Set. Additional line items can be added or removed using the "+" and "-" buttons on the side of the grid.
To run the calculation, click the Calculate button which will run through each line item in the grid and when finished display the results in the main view area.
Users can also choose to overwrite the name of any line item. To return to the default name simply delete all contents of the cell and exit edit mode.
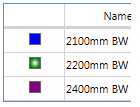
Individual plot lines can be toggled on or off by left clicking the legend color box. Alternatively, if the user right clicks a box, it will show only the plot selected and hide all others.
A reference line can be added by checking the Min Allowable check box.
; 
The image of the chart can be saved by right clicking on the chart.
•Export To Image: will save "png" image of chart to selected directory location.
•Export To CSV: save data points to "csv" text file.
•Copy To Clipboard: allows image to be pasted to a document location.